


| Top Forex Brokers |
|---|

|

|
| Best Social Trading |
|---|

|
Browse Categories
Trading with the Descending Triangle
Live Trade Example 1: A Trade with the Descending Triangle
Trading with descending triangles can be fun. Descending triangles are bearish chart patterns and as a rule, the bearish breakout which accompanies this pattern lasts longer than its bullish ascending triangle counterpart, reflecting the aggressive selling of the base currency in question by traders.
So what then is a descending triangle and how do we benefit from it? A descending triangle is a chart pattern which is formed by the convergence of a horizontal lower trend line (which forms the base of the triangle) and a downward sloping upper trend line. The trend lines are so formed because the sloping upper trend lines mark the highs of the candlesticks which are gradually getting lower, and the horizontal trend lines signifies an area of support.
This pattern is a bearish pattern, as the lower highs signify that the upside pressure on the price action of the currency pair is waning, and the gradual pressure on the horizontal support that this produces will soon lead to a massive downward breakout. There are two ways to trade this pattern.
1) Trading the range
Before we explain this, let me issue a word of caution. This is a trade that should never be attempted by green horns in the forex market. The trade can easily fail. Only professionals can realise the warning signs of failure and exit their positions before anything untoward happens.
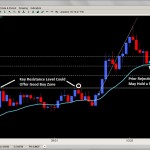
Now let’s discuss the trade proper. The trend lines act as price boundaries. They act as restricting bands to the upside and the downside. As such, the trader can trade the price boundaries with the range of the triangles, so this is a form of range trading. The trader has to draw proper trend lines that cut across at least three points of price peaks, and three horizontal points at which prices form lows. He then buys when the price hits the horizontal trend line, and sells when price hits the sloping upper trend line. This is shown in the chart below:

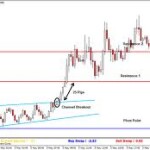
Descending triangle showing sell entry and exit point before the breakout
The bias for a descending triangle is a bearish one, since it is a bearish chart pattern. So the trader should only sell at the upper trend line, and exit the trade at the horizontal trend line. This can be done as the trend lines converge. Once the point of convergence is almost reached, this trade should not be undertaken as the chances of a breakout occurring are very high. However, if you are in active short trade by the time the convergence is near, you may decide to stay in and benefit from any breakout that could occur.
2) The conventional breakout trade
The conventional breakout trade is the one in which the trader uses a Stop order (usually a Sell Stop) to benefit from the bearish breakout, close to the point of divergence.

In order to benefit from this, the stop loss should be placed at an appreciable distance to the upside, beyond the horizontal trend line. An appropriate profit target can be set by the trader.
The chart example shown above is a real live trade that was taken. The trend lines were drawn early before full convergence of the trend lines, and we were able to sell at the upper trend line, and exit at the lower trend lines for some good profit. After three trades, we abandoned this trade type and placed a sell stop order at the point marked by the white line, with our profit target at the S2 support line.
We made 100 pips from the first two trades, and then 60 pips from the breakout trade, making a total of 160 pips, which is not bad for a day’s job, especially as we used a Standard Lot to trade ($1600 in profits).
The descending triangle chart pattern is a good way of making money. Many traders cannot identify these patterns when they occur, so for them, they could use the automatic chart pattern software tools from Autochartist or ChartAdvisor. These tools can be used for free if the trader signs up with the partner forex brokers to which Autochartist and Chartadvisor are affiliated.
Our recommended CFD broker:
![]() This is a higly recommended broker. Enjoy risk-free trading with their free demo account! (Risk warning: 76.4% of retail CFD accounts lose money.)!
This is a higly recommended broker. Enjoy risk-free trading with their free demo account! (Risk warning: 76.4% of retail CFD accounts lose money.)!